Make a microscopic simulation
In the two following models, individuals are seen as spherical particles. They move at a desired velocity to reach a goal (typically a door). Doing nothing more would lead to many overlaps between individuals. Hence the two families of models below can prevent these overlaps through two different approaches. For the Social Force models, and, for some forces are added to act against overlaps, and for the Granular model the velocities are projected into a permissible velocity space which ensures the absence of overlaps.
Granular model
The Granular model comes from crowd motion models of the granular type : each individual is identified to a hard disk of a prescribed size, subject to a non-overlapping constraint with their neighbors. The approach relies on a desired velocity for each individual (the velocity they would take if they were alone), and the global velocity field shall be defined as the closest to the desired one among all those feasible fields (fields which do not lead to overlapping of disks).
Reference : [MF2018] Chapter 4.
An example can be find in the directory
cromosim/examples/micro/granular
and can be launched with
python micro_granular.py --json input_room.json
python micro_granular.py --json input_event.json
python micro_granular.py --json input_stadium.json
python micro_granular.py --json input_shibuya_crossing.json
python micro_granular.py --json input_stairs.json
|
|
|---|
|
|
|
|
|---|
|
|
|
|
|
|---|---|
|
|
|
|
|
|---|
|
|
|
Floor 1 on the left and 0 on the right |
|---|
|
|
1# Authors:
2# Sylvain Faure <sylvain.faure@universite-paris-saclay.fr>
3# Bertrand Maury <bertrand.maury@universite-paris-saclay.fr>
4#
5# cromosim/examples/micro/granular/micro_granular.py
6# python micro_granular.py --json input.json
7#
8# License: GPL
9
10
11import sys
12import os
13import json
14from optparse import OptionParser
15import numpy as np
16import matplotlib.pyplot as plt
17from matplotlib.patches import Circle, Ellipse, Rectangle, Polygon
18from matplotlib.lines import Line2D
19
20from cromosim.domain import Domain
21from cromosim.domain import Destination
22from cromosim.micro import people_initialization, plot_people, plot_sensors
23from cromosim.micro import find_duplicate_people, compute_contacts
24from cromosim.micro import projection, move_people, people_update_destination
25
26plt.ion()
27
28"""
29 python3 micro_granular.py --json input.json
30"""
31parser = OptionParser(usage="usage: %prog [options] filename",
32 version="%prog 1.0")
33parser.add_option('--json', dest="jsonfilename", default="input.json",
34 type="string", action="store", help="Input json filename")
35opt, remainder = parser.parse_args()
36print("===> JSON filename = ", opt.jsonfilename)
37with open(opt.jsonfilename) as json_file:
38 try:
39 input = json.load(json_file)
40 except json.JSONDecodeError as msg:
41 print(msg)
42 print("Failed to load json file ", opt.jsonfilename)
43 print("Check its content \
44 (https://fr.wikipedia.org/wiki/JavaScript_Object_Notation)")
45 sys.exit()
46
47"""
48 Get parameters from json file :
49 prefix: string
50 Folder name to store the results
51 with_graphes: bool
52 true if all the graphes are shown and saved in png files,
53 false otherwise
54 seed: integer
55 Random seed which can be used to reproduce a random selection
56 if >0
57 For each domain :
58 | name: string
59 | Domain name
60 | background: string
61 | Image file used as background
62 | px: float
63 | Pixel size in meters (also called space step)
64 | width: integer
65 | Domain width (equal to the width of the background image)
66 | height: integer
67 | Domain height (equal to the height of the background image)
68 | wall_colors: list
69 | rgb colors for walls
70 | [ [r,g,b],[r,g,b],... ]
71 | shape_lines: list
72 | Used to define the Matplotlib Polyline shapes,
73 | [
74 | {
75 | "xx": [x0,x1,x2,...],
76 | "yy": [y0,y1,y2,...],
77 | "linewidth": float,
78 | "outline_color": [r,g,b],
79 | "fill_color": [r,g,b]
80 | },...
81 | ]
82 | shape_circles: list
83 | Used to define the Matplotlib Circle shapes,
84 | [
85 | {
86 | "center_x": float,
87 | "center_y": float,
88 | "radius": float,
89 | "outline_color": [r,g,b],
90 | "fill_color": [r,g,b]
91 | },...
92 | ]
93 | shape_ellipses: list
94 | Used to define the Matplotlib Ellipse shapes,
95 | [
96 | {
97 | "center_x": float,
98 | "center_y": float,
99 | "width": float,
100 | "height": float,
101 | "angle_in_degrees_anti-clockwise": float (degre),
102 | "outline_color": [r,g,b],
103 | "fill_color": [r,g,b]
104 | },...
105 | ]
106 | shape_rectangles: list
107 | Used to define the Matplotlib Rectangle shapes,
108 | [
109 | {
110 | "bottom_left_x": float,
111 | "bottom_left_y": float,
112 | "width": float,
113 | "height": float,
114 | "angle_in_degrees_anti-clockwise": float (degre),
115 | "outline_color": [r,g,b],
116 | "fill_color": [r,g,b]
117 | },...
118 | ]
119 | shape_polygons: list
120 | Used to define the Matplotlib Polygon shapes,
121 | [
122 | {
123 | "xy": float,
124 | "outline_color": [r,g,b],
125 | "fill_color": [r,g,b]
126 | },...
127 | ]
128 | destinations: list
129 | Used to define the Destination objects,
130 | [
131 | {
132 | "name": string,
133 | "colors": [[r,g,b],...],
134 | "excluded_colors": [[r,g,b],...],
135 | "desired_velocity_from_color": [] or
136 | [
137 | {
138 | "color": [r,g,b],
139 | "desired_velocity": [ex,ey]
140 | },...
141 | ],
142 | "velocity_scale": float,
143 | "next_destination": null or string,
144 | "next_domain": null or string,
145 | "next_transit_box": null or [[x0,y0],...,[x3,y3]]
146 | },...
147 | ]
148 |--------------------
149 For each group of persons, required for the initialization process:
150 | nb:
151 | Number of people in the group
152 | domain:
153 | Name of the domain where people are located
154 | radius_distribution:
155 | Radius distribution used to create people
156 | ["uniform",min,max] or ["normal",mean,sigma]
157 | velocity_distribution:
158 | Velocity distribution used to create people
159 | ["uniform",min,max] or ["normal",mean,sigma]
160 | box:
161 | Boxe to randomly position people at initialization
162 | [ [x0,y0],[x1,y1],...]
163 | destination:
164 | Initial destination for the group
165 |--------------------
166 For each sensor:
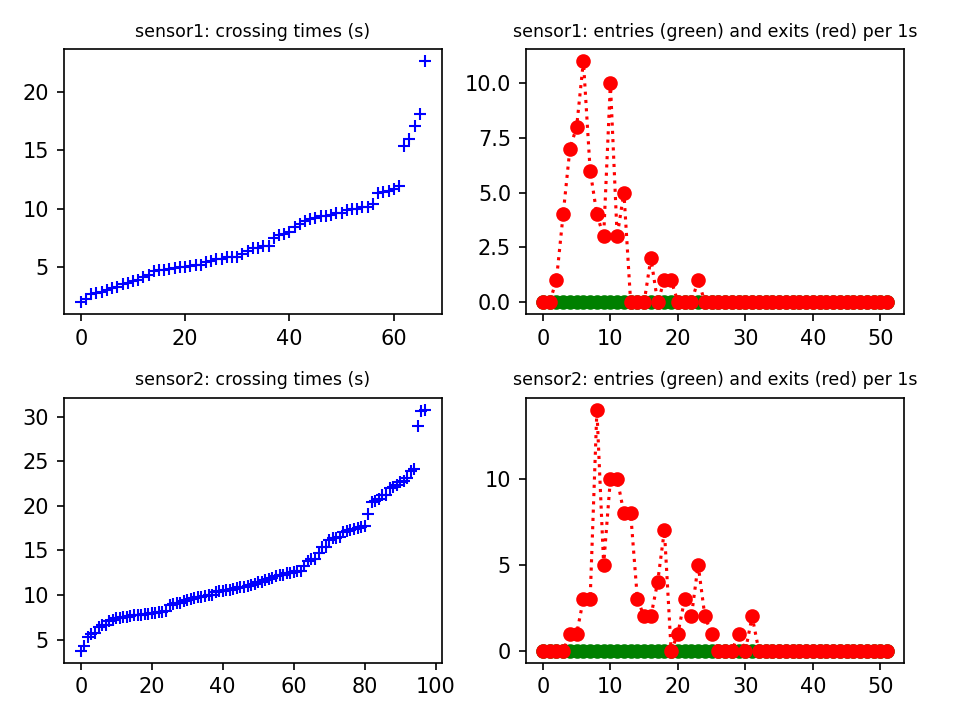
167 | domain:
168 | Name of the domain where the sensor is located
169 | line:
170 | Segment through which incoming and outgoing flows are measured
171 | [x0,y0,x1,y1]
172 |--------------------
173 Tf: float
174 Final time
175 dt: float
176 Time step
177 drawper: integer
178 The results will be displayed every "drawper" iterations
179 projection_method: string
180 Name of the projection method : cvxopt(default),
181 mosek(a licence is needed) or uzawa
182 dmax: float
183 Maximum distance used to detect neighbors
184 dmin_people: float
185 Minimum distance allowed between individuals
186 dmin_walls: float
187 Minimum distance allowed between an individual and a wall
188 plot_people: boolean
189 If true, people are drawn
190 plot_contacts: boolean
191 If true, active contacts between people are drawn
192 plot_desired_velocities: boolean
193 If true, people desired velocities are drawn
194 plot_velocities: boolean
195 If true, people velocities are drawn
196 plot_sensors: boolean
197 If true, plot sensor lines on people graph and sensor data graph
198 plot_paths: boolean
199 If true, plot people paths
200"""
201
202prefix = input["prefix"]
203if not os.path.exists(prefix):
204 os.makedirs(prefix)
205seed = input["seed"]
206with_graphes = input["with_graphes"]
207json_domains = input["domains"]
208# print("===> JSON data used to build the domains : ",json_domains)
209json_people_init = input["people_init"]
210# print("===> JSON data used to create groups : ",json_people_init)
211json_sensors = input["sensors"]
212# print("===> JSON data used to create sensors : ",json_sensors)
213Tf = input["Tf"]
214dt = input["dt"]
215drawper = input["drawper"]
216projection_method = input["projection_method"]
217dmax = input["dmax"]
218dmin_people = input["dmin_people"]
219dmin_walls = input["dmin_walls"]
220plot_p = input["plot_people"]
221plot_c = input["plot_contacts"]
222plot_v = input["plot_velocities"]
223plot_vd = input["plot_desired_velocities"]
224plot_s = input["plot_sensors"]
225plot_pa = input["plot_paths"]
226print("===> Final time, Tf = ", Tf)
227print("===> Time step, dt = ", dt)
228print("===> To draw the results each drawper iterations, drawper = ", drawper)
229print("===> Maximal distance to find neighbors, dmax = ", dmax, ", example : 2*dt")
230print("===> Minimal distance between persons, dmin_people = ", dmin_people)
231print("===> Minimal distance between a person and a wall, dmin_walls = ", dmin_walls)
232
233"""
234 Build the Domain objects
235"""
236domains = {}
237
238for i, jdom in enumerate(json_domains):
239 jname = jdom["name"]
240 print("===> Build domain number ", i, " : ", jname)
241 jbg = jdom["background"]
242 jpx = jdom["px"]
243 jwidth = jdom["width"]
244 jheight = jdom["height"]
245 jwall_colors = jdom["wall_colors"]
246 if (jbg == ""):
247 dom = Domain(name=jname, pixel_size=jpx, width=jwidth,
248 height=jheight, wall_colors=jwall_colors)
249 else:
250 dom = Domain(name=jname, background=jbg, pixel_size=jpx,
251 wall_colors=jwall_colors)
252 # To add lines : Line2D(xdata, ydata, linewidth)
253 for sl in jdom["shape_lines"]:
254 line = Line2D(sl["xx"], sl["yy"], linewidth=sl["linewidth"])
255 dom.add_shape(line, outline_color=sl["outline_color"],
256 fill_color=sl["fill_color"])
257 # To add circles : Circle( (center_x,center_y), radius )
258 for sc in jdom["shape_circles"]:
259 circle = Circle((sc["center_x"], sc["center_y"]), sc["radius"])
260 dom.add_shape(circle, outline_color=sc["outline_color"],
261 fill_color=sc["fill_color"])
262 # To add ellipses : Ellipse( (center_x,center_y), width, height,
263 # angle_in_degrees_anti-clockwise )
264 for se in jdom["shape_ellipses"]:
265 ellipse = Ellipse((se["center_x"], se["center_y"]),
266 se["width"], se["height"],
267 se["angle_in_degrees_anti-clockwise"])
268 dom.add_shape(ellipse, outline_color=se["outline_color"],
269 fill_color=se["fill_color"])
270 # To add rectangles : Rectangle( (bottom_left_x,bottom_left_y),
271 # width, height, angle_in_degrees_anti-clockwise )
272 for sr in jdom["shape_rectangles"]:
273 rectangle = Rectangle((sr["bottom_left_x"], sr["bottom_left_y"]),
274 sr["width"], sr["height"],
275 sr["angle_in_degrees_anti-clockwise"])
276 dom.add_shape(rectangle, outline_color=sr["outline_color"],
277 fill_color=sr["fill_color"])
278 # To add polygons : Polygon( [[x0,y0],[x1,y1],...] )
279 for spo in jdom["shape_polygons"]:
280 polygon = Polygon(spo["xy"])
281 dom.add_shape(polygon, outline_color=spo["outline_color"],
282 fill_color=spo["fill_color"])
283 # To build the domain : background + shapes
284 dom.build_domain()
285 # To add all the available destinations
286 for j, dd in enumerate(jdom["destinations"]):
287 desired_velocity_from_color = []
288 for gg in dd["desired_velocity_from_color"]:
289 desired_velocity_from_color.append(
290 np.concatenate((gg["color"], gg["desired_velocity"])))
291 dest = Destination(name=dd["name"], colors=dd["colors"],
292 excluded_colors=dd["excluded_colors"],
293 desired_velocity_from_color=desired_velocity_from_color,
294 velocity_scale=dd["velocity_scale"],
295 next_destination=dd["next_destination"],
296 next_domain=dd["next_domain"],
297 next_transit_box=dd["next_transit_box"])
298 print("===> Destination : ", dest)
299 dom.add_destination(dest)
300 if (with_graphes):
301 dom.plot_desired_velocity(dd["name"], id=100*i+10+j, step=20)
302
303 print("===> Domain : ", dom)
304 if (with_graphes):
305 dom.plot(id=100*i)
306 dom.plot_wall_dist(id=100*i+1, step=20)
307
308 domains[dom.name] = dom
309
310print("===> All domains = ", domains)
311
312
313"""
314 To create the sensors to measure the pedestrian flows
315"""
316
317all_sensors = {}
318for domain_name in domains:
319 all_sensors[domain_name] = []
320for s in json_sensors:
321 s["id"] = []
322 s["times"] = []
323 s["xy"] = []
324 s["dir"] = []
325 all_sensors[s["domain"]].append(s)
326 # print("===> All sensors = ",all_sensors)
327
328"""
329 Initialization
330"""
331
332# Current time
333t = 0.0
334counter = 0
335
336# Initialize people
337all_people = {}
338for i, peopledom in enumerate(json_people_init):
339 dom = domains[peopledom["domain"]]
340 groups = peopledom["groups"]
341 print("===> Group number ", i, ", domain = ", peopledom["domain"])
342 people = people_initialization(dom, groups, dt,
343 dmin_people=dmin_people, dmin_walls=dmin_walls, seed=seed,
344 itermax=10, projection_method=projection_method, verbose=True)
345 II, JJ, Vd = dom.people_desired_velocity(people["xyrv"], people["destinations"])
346 people["Vd"] = Vd
347 for ip, pid in enumerate(people["id"]):
348 people["paths"][pid] = people["xyrv"][ip, :2]
349 contacts = None
350 if (with_graphes):
351 colors = people["xyrv"][:, 2]
352 plot_people(100*i+20, dom, people, contacts, colors, time=t,
353 plot_people=plot_p, plot_contacts=plot_c,
354 plot_velocities=plot_v, plot_desired_velocities=plot_vd,
355 plot_sensors=plot_s, sensors=all_sensors[dom.name],
356 savefig=True, filename=prefix+dom.name+'_fig_' +
357 str(counter).zfill(6)+'.png')
358 all_people[peopledom["domain"]] = people
359# print("===> All people = ",all_people)
360
361"""
362 Main loop
363"""
364
365cc = 0
366draw = True
367
368while (t < Tf):
369
370 print("\n===> Time = "+str(t))
371
372 # Compute people desired velocity
373 for idom, name in enumerate(domains):
374 print("===> Compute desired velocity for domain ", name)
375 dom = domains[name]
376 people = all_people[name]
377 II, JJ, Vd = dom.people_desired_velocity(
378 people["xyrv"],
379 people["destinations"])
380 people["Vd"] = Vd
381 people["I"] = II
382 people["J"] = JJ
383
384 # Look at if there are people in the transit boxes
385 print("===> Find people who have to be duplicated")
386 virtual_people = find_duplicate_people(all_people, domains)
387 # print(" virtual_people : ",virtual_people)
388
389 # Projection
390 for idom, name in enumerate(domains):
391 print("===> Projection step for domain ", name)
392 dom = domains[name]
393 people = all_people[name]
394
395 try:
396 xyrv = np.concatenate(
397 (people["xyrv"], virtual_people[name]["xyrv"]))
398 Vd = np.concatenate(
399 (people["Vd"], virtual_people[name]["Vd"]))
400 except:
401 xyrv = people["xyrv"]
402 Vd = people["Vd"]
403
404 if (xyrv.shape[0] > 0):
405
406 if (np.unique(xyrv, axis=0).shape[0] != xyrv.shape[0]):
407 print("===> ERROR : There are two identical lines \
408 in the")
409 print(" array xyrv used to determine the \
410 contacts between")
411 print(" individuals and this is not normal.")
412 sys.exit()
413
414 contacts = compute_contacts(dom, xyrv, dmax)
415 print(" Number of contacts: ", contacts.shape[0])
416 info, B, U, L, P = projection(
417 dt, xyrv,
418 contacts, Vd,
419 dmin_people=dmin_people,
420 dmin_walls=dmin_walls,
421 method=projection_method,
422 log=True)
423 nn = people["xyrv"].shape[0]
424 all_people[name]["U"] = U[:nn, :]
425 virtual_people[name]["U"] = U[nn:, :]
426 all_people[name], all_sensors[name] = move_people(
427 t, dt,
428 all_people[name],
429 all_sensors[name])
430
431 if (draw and with_graphes):
432 # coloring people according to their radius
433 colors = all_people[name]["xyrv"][:, 2]
434 # coloring people according to their destinations
435 # colors = np.zeros(all_people[name]["xyrv"].shape[0])
436 # for i,dest_name in enumerate(list(dom.destinations.keys())):
437 # ind = np.where(all_people[name]["destinations"]==dest_name)[0]
438 # if (ind.shape[0]>0):
439 # colors[ind]=i
440 plot_people(100*idom+20, dom, all_people[name], contacts,
441 colors, virtual_people=virtual_people[name], time=t,
442 plot_people=plot_p, plot_contacts=plot_c,
443 plot_paths=plot_pa, plot_velocities=plot_v,
444 plot_desired_velocities=plot_vd, plot_sensors=plot_s,
445 sensors=all_sensors[dom.name], savefig=True,
446 filename=prefix+dom.name+'_fig_'
447 + str(counter).zfill(6)+'.png')
448 plt.pause(0.05)
449
450 # Update people destinations
451 all_people = people_update_destination(all_people, domains, dom.pixel_size)
452
453 # Print the number of persons for each domain
454 for idom, name in enumerate(domains):
455 print("===> Domain ", name, " nb of persons = ",
456 all_people[name]["xyrv"].shape[0])
457
458 t += dt
459 cc += 1
460 counter += 1
461 if (cc >= drawper):
462 draw = True
463 cc = 0
464 else:
465 draw = False
466
467for idom, domain_name in enumerate(all_sensors):
468 print("===> Plot sensors of domain ", domain_name)
469 plot_sensors(100*idom+40, all_sensors[domain_name], t, savefig=True,
470 filename=prefix+'sensor_'+str(i)+'_'+str(counter)+'.png')
471 plt.pause(0.05)
472
473plt.ioff()
474plt.show()
475sys.exit()
Social force model
The Social Force model has been introduced in the 90’s. Pedestrians are identified with inertial particles submitted to a forcing term which implements the individual tendencies and extra forces which account for interactions with other pedestrians (typically the tendency to preserve a certain distance with neighbors).
Reference : [MF2018] Chapter 3.
Some examples can be found in the directory
and can be launched with
Floor 1 on the left and 0 on the right