Build a domain
A Domain object contains:
a geometry defined by a background image (completely white by default) and Matplotlib shapes that can be added (lines, circles, ellipses, rectangles or polygons). Depending on the color chosen for a shape, its meaning changes. For example, you can decide that a red line corresponds to one door and a green line represents another. To build a computational domain, we therefore use a background image (drawing, map of the site, satellite photo, etc.) or we leave an entirely white background, then we optionally add colored shapes, and finally we define a color code. In general the walls are coded in black. All colors are taken in rgb format: [r, g, b] with r, g and b integers between 0 and 255.
a 2D array of the size of the image representing the distance to the nearest wall (coded by all the colors defined in wall_colors). This means that each pixel in the image has its distance to the nearest wall.
A set of possible destinations attributable to people. A destination is defined by a Destination object which contains all the elements useful for its construction: the color codes representing the destination on the domain (red for a door represented by a red line for example), exclusion zones also defined via colors (black for an impassable wall for example), the names of the next destination and the next domain (we can chain several destinations to go up one floor: one Domain object per floor, one Destination object leading to the stairs, another to climb the stairs, etc …). Each destination will contain a 2D array of the size of the image containing the distance to the objective (the aimed door for example). The opposite of the gradient of this distance represents the desired direction (or named desired velocity) for an individual desiring to reach this outcome. This desired direction is also stored in an array.
Reference : [MF2018] Chapter 8.
All the following examples can be found in the directory
cromosim/examples/domain/
The simplest example
python domain_room.py
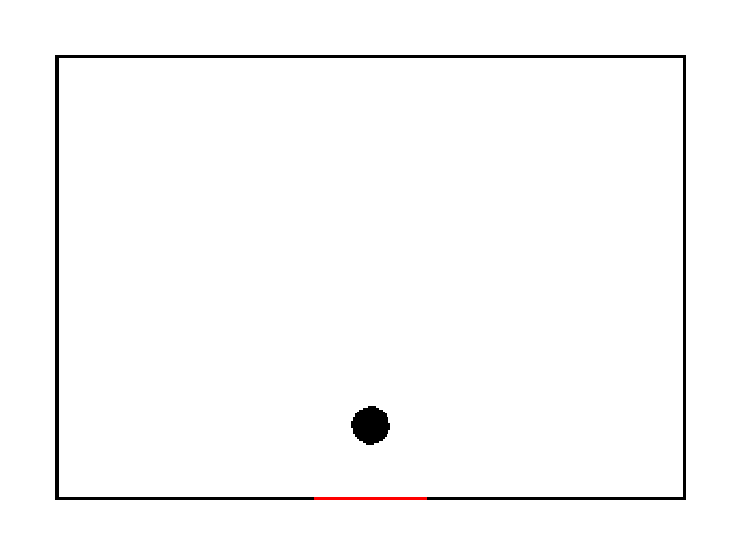
This domain uses an image as background and two forms: a red line used to define a door and a black disc to add an obstacle a few meters before the door.
|
|
|
|
1import matplotlib.pyplot as plt
2from matplotlib.patches import Circle
3from matplotlib.lines import Line2D
4
5from cromosim.domain import Domain
6from cromosim.domain import Destination
7
8# To create a Domain object from a background image
9dom = Domain(name='room', background='room.png', pixel_size=0.1)
10
11# To define the color for the walls
12wall_color = [0, 0, 0]
13
14# To add an obstacle using a matplotlib shape colored with wall_color :
15# Circle( (center_x,center_y), radius )
16circle = Circle((20.0, 7.0), 1.0)
17dom.add_shape(circle, outline_color=wall_color, fill_color=wall_color)
18
19# To define the color for the issue of the room
20door_color = [255, 0, 0]
21
22# To add a door using a matplotlib shape :
23# Line2D(xdata, ydata, linewidth)
24line = Line2D([17.0, 23.0], [3.1, 3.1], linewidth=2)
25dom.add_shape(line, outline_color=door_color, fill_color=door_color)
26
27# To build the domain :
28dom.build_domain()
29
30# To plot the domain : backgroud + added shapes
31dom.plot(id=1, title="Domain")
32
33# To create a Destination object towards the door
34dest = Destination(name='door', colors=[door_color],
35 excluded_colors=[wall_color])
36dom.add_destination(dest)
37
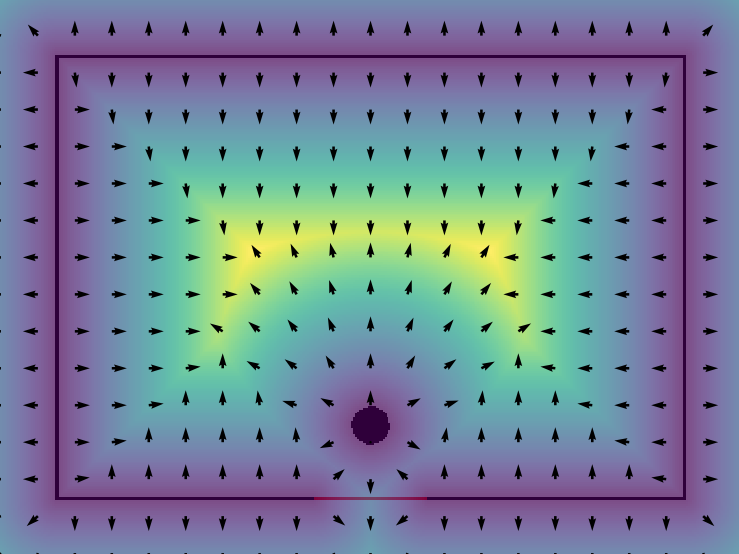
38# To plot the wall distance and its gradient
39dom.plot_wall_dist(id=2, step=20,
40 title="Distance to walls and its gradient",
41 savefig=False, filename="room_wall_distance.png")
42
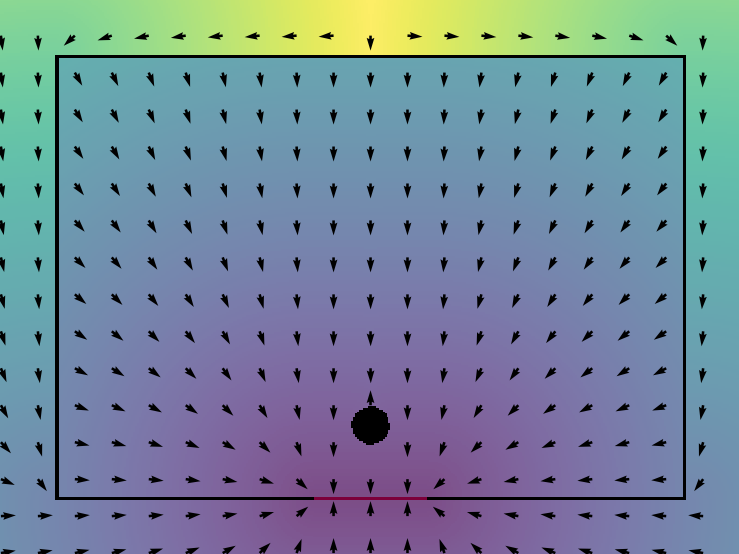
43# To plot the distance to the red door and the correspondant
44# desired velocity
45dom.plot_desired_velocity('door', id=3, step=20,
46 title="Distance to the destination and desired velocity",
47 savefig=False, filename="room_desired_velocity.png")
48
49print("===> Domain: ", dom)
50
51plt.show()
A circular domain
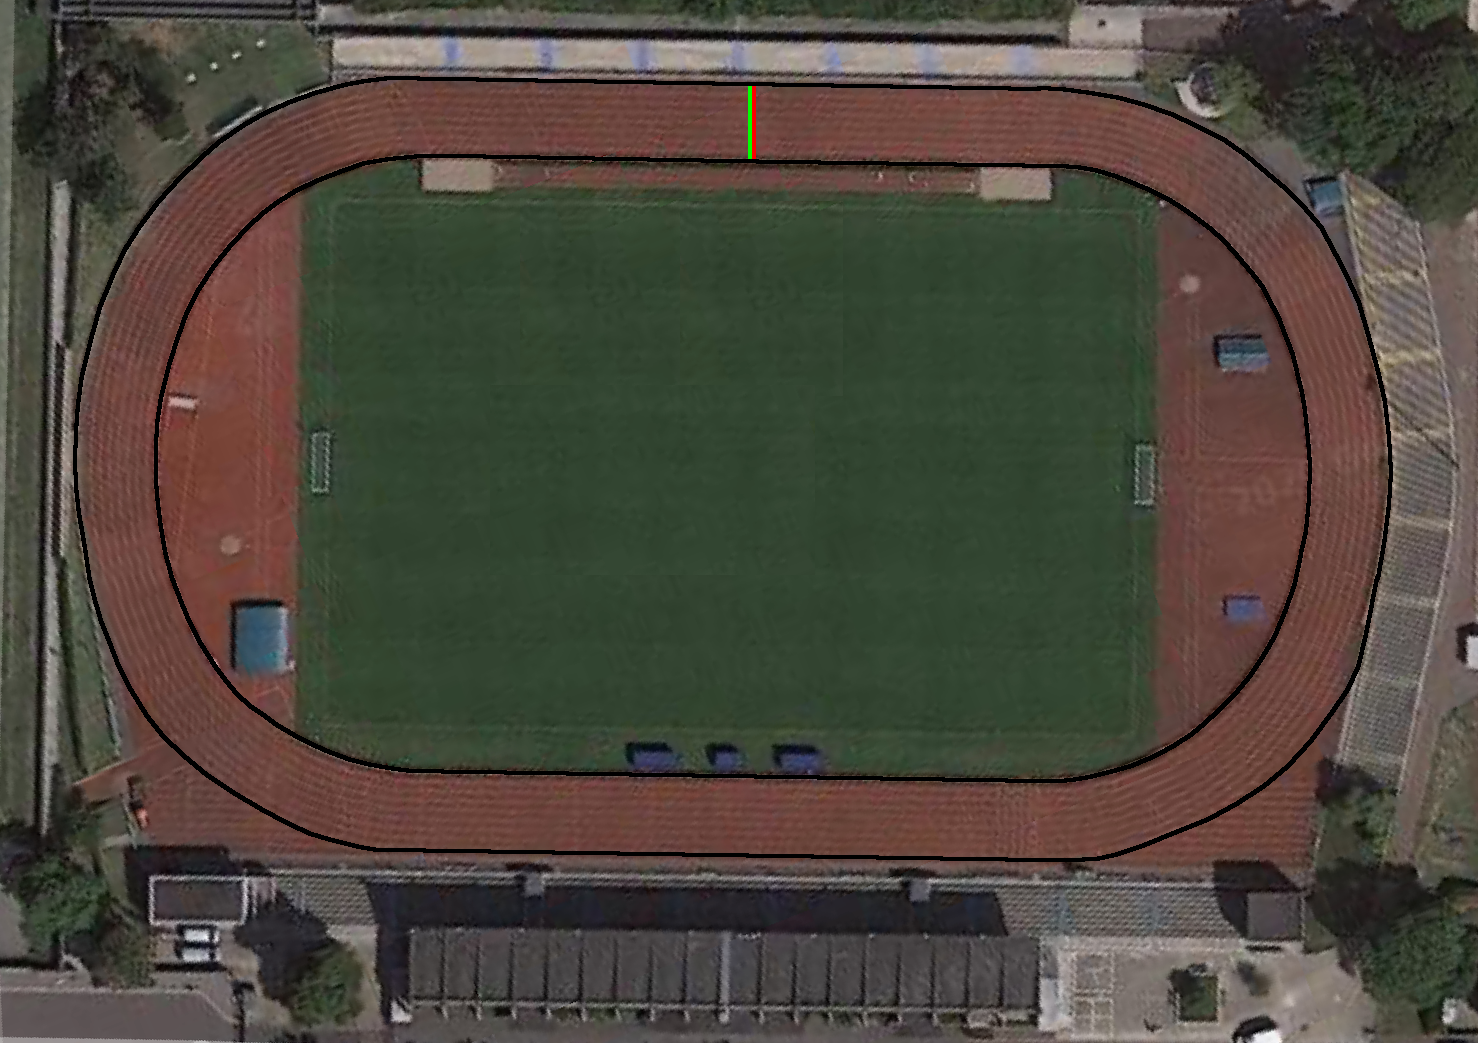
python domain_stadium.py
This domain contains black walls rgb=[0,0,0], a red line rgb=[255,0,0] and a green line rgb=[0,255,0], all included in the given background.
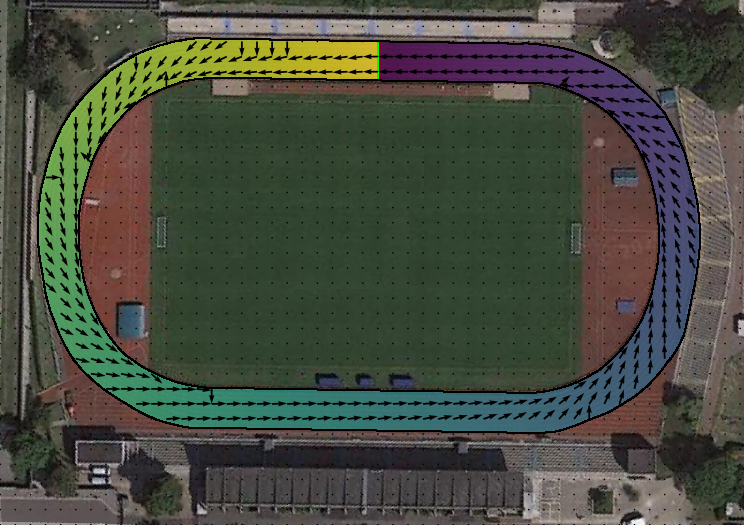
If we calculate the desired velocity leading to the red line by solving the Eikonal equation using a Fast-Marching method, then we get arrows directed towards this line at any point on the track. For example, a person just to the right of the line will go to the left and a person just to the left will go to the right, so people will not turn around the track.
To correct this problem, we add a fictitious wall (green line) used only during the Fast-Marching method: thanks to it a person located to the left of the red line will go to the left and go around the track.
Finally if we want people to do several laps, we impose a desired velocity equal to (-1.0) on the green and red pixels using the desired_velocity_from_color option of the Destination object.

|
|
|
|
1import matplotlib.pyplot as plt
2
3from cromosim.domain import Domain
4from cromosim.domain import Destination
5
6# To create a Domain object from a background image
7# By default the black color is for the walls
8dom = Domain(name='stadium', pixel_size=0.1, background="stadium.png")
9
10# To build the domain :
11dom.build_domain()
12
13# To plot the domain : backgroud + added shapes (none here, they were added
14# directly to the drawing using drawing software)
15dom.plot(id=1, title="Domain")
16
17# To create a Destination object towards the red line
18# Since the domain is circular here, we want people to go to the red line
19# and then cross it and continue to turn. For this, the color green is used
20# to block one side of the track when calculating the desired velocity (as a
21# temporary wall will do). Once this calculation is done, the desired speed
22# is imposed at [-1,0] on the red and green pixels..
23dest = Destination(name='running_track',
24 colors=[[255, 0, 0]],
25 excluded_colors=[[0, 0, 0], [0, 255, 0]],
26 desired_velocity_from_color=[[255, 0, 0, -1, 0], [0, 255, 0, -1, 0]])
27dom.add_destination(dest)
28
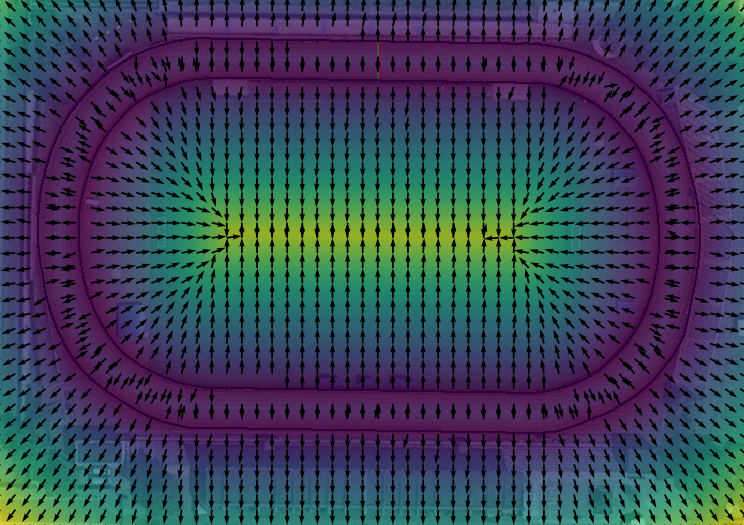
29# To plot the wall distance and its gradient
30dom.plot_wall_dist(id=2, step=30,
31 title="Distance to walls and its gradient",
32 savefig=False, filename="stadium_wall_distance.png")
33
34# To plot the distance to the red line and the correspondant desired velocity
35dom.plot_desired_velocity('running_track', id=3, step=30,
36 title="Distance to the destination and desired velocity",
37 savefig=False, filename="stadium_desired_velocity.png")
38
39print("===> Domain: ", dom)
40
41plt.show()
A domain with several destinations
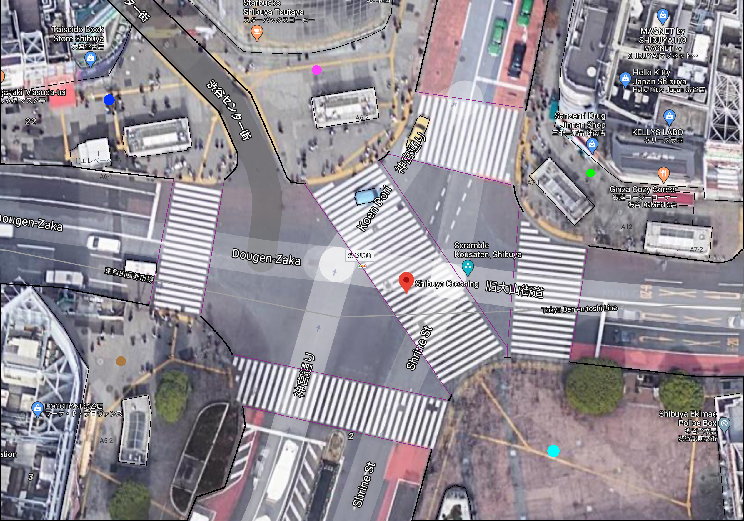
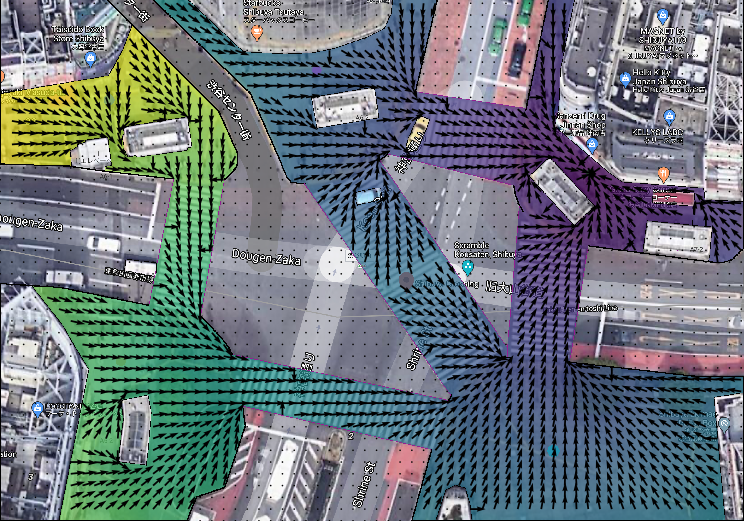
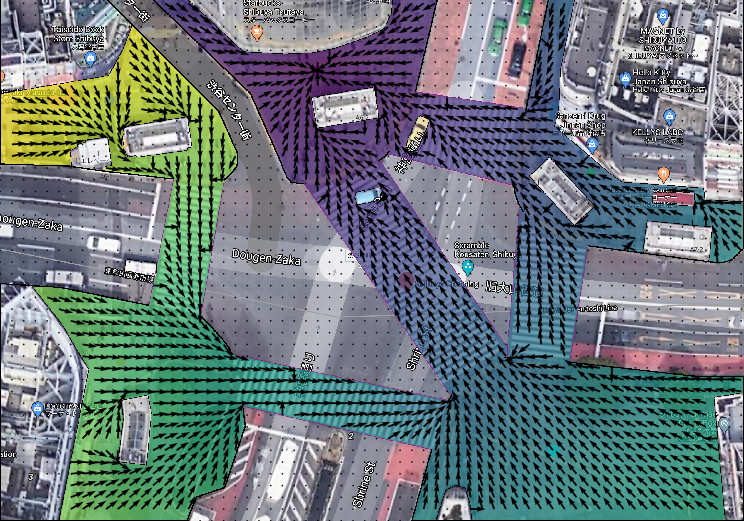
python domain_shibuya_crossing.py
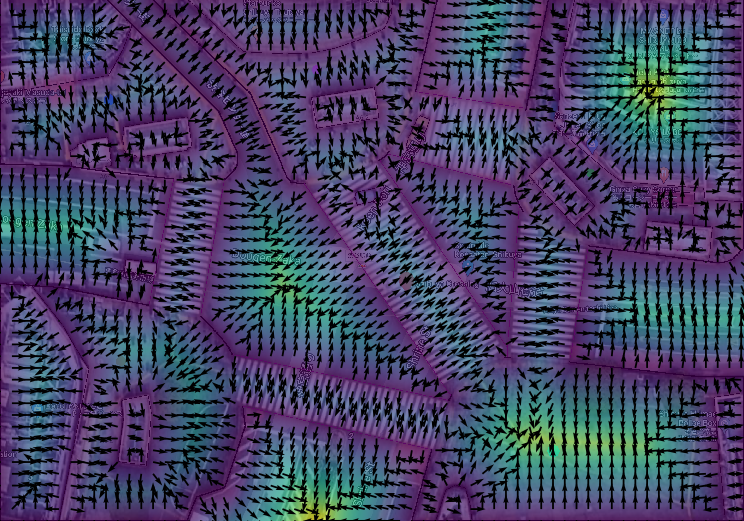
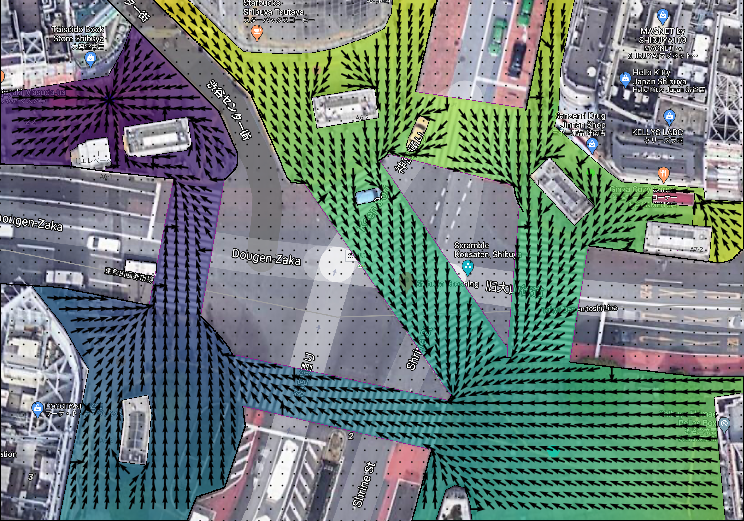
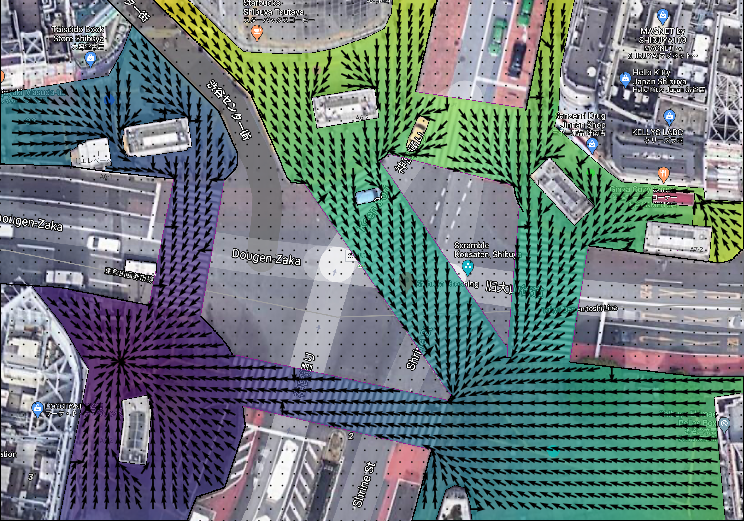
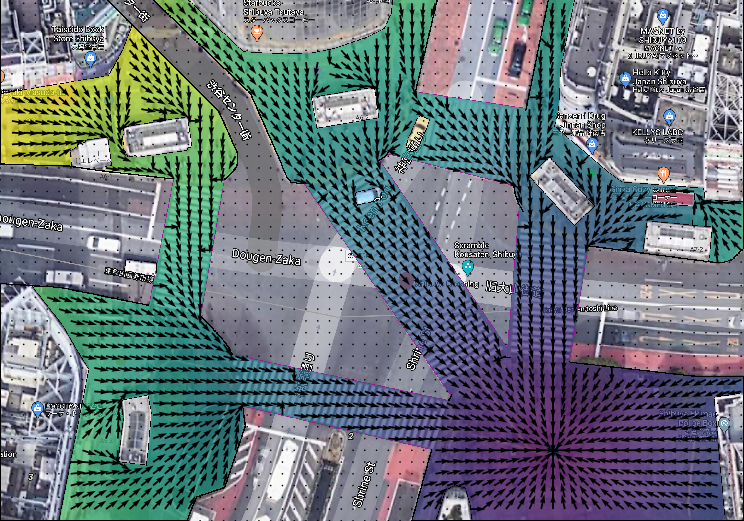
Shibuya Crossing is a popular scramble crossing in Shibuya, Tokyo, Japan. Here some walls have been added (magenta walls) to channel pedestrians on the pedestrian crossings and we have defined five destinations leading to five disks of different colors (blue, brown, cyan, green and pink).
|
|
|
|
|
|
|
 1import matplotlib.pyplot as plt
 2
 3from cromosim.domain import Domain
 4from cromosim.domain import Destination
 5
 6
 7# The walls are represented here by the black and magenta colors
 8black = [0, 0, 0]
 9magenta = [148, 33, 146]
10wall_colors = [black, magenta]
11
12# To create a Domain object from a background image
13dom = Domain(name='shibuya_crossing',
14             pixel_size=0.033,
15             background="shibuya_crossing.png",
16             wall_colors=wall_colors)
17
18# To build the domain :
19dom.build_domain()
20
21# To plot the domain
22dom.plot(id=1, title="Domain")
23
24# To define all the destinations
25
26# --> towards the blue disk
27blue = [4, 51, 255]
28dest_blue = Destination(name='blue', colors=[blue], excluded_colors=wall_colors)
29dom.add_destination(dest_blue)
30
31# --> towards the brown disk
32brown = [170, 121, 66]
33dest_brown = Destination(name='brown', colors=[brown],
34                         excluded_colors=wall_colors)
35dom.add_destination(dest_brown)
36
37# --> towards the cyan disk
38cyan = [0, 253, 255]
39dest_cyan = Destination(name='cyan', colors=[cyan],
40                        excluded_colors=wall_colors)
41dom.add_destination(dest_cyan)
42
43# --> towards the green disk
44green = [0, 249, 0]
45dest_green = Destination(name='green', colors=[green],
46                         excluded_colors=wall_colors)
47dom.add_destination(dest_green)
48
49# --> towards the pink disk
50pink = [255, 64, 255]
51dest_pink = Destination(name='pink', colors=[pink],
52                        excluded_colors=wall_colors)
53dom.add_destination(dest_pink)
54
55print("===> Domain: ", dom)
56
57# To plot the wall distance and its gradient
58dom.plot_wall_dist(id=3, step=40,
59                   title="Distance to walls and its gradient",
60                   savefig=False, filename="shibuya_crossing_wall_distance.png")
61
62# To plot all the desired velocity fields
63dom.plot_desired_velocity('blue', id=4, step=40,
64                          title='Distance to the destination "blue" and desired velocity',
65                          savefig=False, filename="shibuya_crossing_blue.png")
66
67dom.plot_desired_velocity('brown', id=5, step=40,
68                          title='Distance to the destination "brown" and desired velocity',
69                          savefig=False, filename="shibuya_crossing_brown.png")
70
71dom.plot_desired_velocity('cyan', id=6, step=40,
72                          title='Distance to the destination "cyan" and desired velocity',
73                          savefig=False, filename="shibuya_crossing_cyan.png")
74
75dom.plot_desired_velocity('green', id=7, step=40,
76                          title='Distance to the destination "green" and desired velocity',
77                          savefig=False, filename="shibuya_crossing_green.png")
78
79dom.plot_desired_velocity('pink', id=8, step=40,
80                          title='Distance to the destination "pink" and desired velocity',
81                          savefig=False, filename="shibuya_crossing_pink.png")
82
83plt.show()
A domain build from a json file
python domain_from_json.py --json input_room.json
python domain_from_json.py --json input_stadium.json
python domain_from_json.py --json input_shibuya_crossing.json
JSON (JavaScript Object Notation) is a lightweight data-interchange format which can be used to describe one or more domains. This means in our case that with a single python script taking as argument a json file we will be able to build several domains.
  1import numpy as np
  2import sys
  3import json
  4from optparse import OptionParser
  5import matplotlib.pyplot as plt
  6from matplotlib.patches import Circle, Ellipse, Rectangle, Polygon
  7from matplotlib.lines import Line2D
  8
  9from cromosim.domain import Domain
 10from cromosim.domain import Destination
 11
 12# Parse the arguments of the python command. Then the json file is loaded.
 13parser = OptionParser(usage="usage: %prog [options] filename",
 14                      version="%prog 1.0")
 15parser.add_option('--json', dest="jsonfilename",
 16                  default="input.json", type="string",
 17                  action="store", help="Input json filename")
 18opt, remainder = parser.parse_args()
 19print("===> JSON filename = ", opt.jsonfilename)
 20with open(opt.jsonfilename) as json_file:
 21    try:
 22        input = json.load(json_file)
 23    except json.JSONDecodeError as msg:
 24        print(msg)
 25        print("Failed to load json file ", opt.jsonfilename)
 26        print("Check its content :")
 27        print("https://fr.wikipedia.org/wiki/JavaScript_Object_Notation)")
 28        sys.exit()
 29
 30"""
 31    Get parameters from json file :
 32    For the domain :
 33    |    name: string
 34    |        Domain name
 35    |    background: string
 36    |        Image file used as background
 37    |    px: float
 38    |        Pixel size in meters (also called space step)
 39    |    width: integer
 40    |        Domain width (equal to the width of the background image)
 41    |    height: integer
 42    |        Domain height (equal to the height of the background image)
 43    |    wall_colors: list
 44    |        rgb colors for walls
 45    |        [ [r,g,b],[r,g,b],... ]
 46    |    shape_lines: list
 47    |        Used to define the Matplotlib Polyline shapes,
 48    |        [
 49    |          {
 50    |             "xx": [x0,x1,x2,...],
 51    |             "yy": [y0,y1,y2,...],
 52    |             "linewidth": float,
 53    |             "outline_color": [r,g,b],
 54    |             "fill_color": [r,g,b]
 55    |          },...
 56    |        ]
 57    |    shape_circles: list
 58    |        Used to define the Matplotlib Circle shapes,
 59    |        [
 60    |           {
 61    |             "center_x": float,
 62    |             "center_y": float,
 63    |             "radius": float,
 64    |             "outline_color": [r,g,b],
 65    |             "fill_color": [r,g,b]
 66    |            },...
 67    |        ]
 68    |    shape_ellipses: list
 69    |        Used to define the Matplotlib Ellipse shapes,
 70    |        [
 71    |           {
 72    |             "center_x": float,
 73    |             "center_y": float,
 74    |             "width": float,
 75    |             "height": float,
 76    |             "angle_in_degrees_anti-clockwise": float (degre),
 77    |             "outline_color": [r,g,b],
 78    |             "fill_color": [r,g,b]
 79    |            },...
 80    |        ]
 81    |    shape_rectangles: list
 82    |        Used to define the Matplotlib Rectangle shapes,
 83    |        [
 84    |           {
 85    |             "bottom_left_x": float,
 86    |             "bottom_left_y": float,
 87    |             "width": float,
 88    |             "height": float,
 89    |             "angle_in_degrees_anti-clockwise": float (degre),
 90    |             "outline_color": [r,g,b],
 91    |             "fill_color": [r,g,b]
 92    |            },...
 93    |        ]
 94    |    shape_polygons: list
 95    |        Used to define the Matplotlib Polygon shapes,
 96    |        [
 97    |           {
 98    |             "xy": float,
 99    |             "outline_color": [r,g,b],
100    |             "fill_color": [r,g,b]
101    |            },...
102    |        ]
103    |    destinations: list
104    |        Used to define the Destination objects,
105    |        [
106    |           {
107    |             "name": string,
108    |             "colors": [[r,g,b],...],
109    |             "excluded_colors": [[r,g,b],...],
110    |             "desired_velocity_from_color": [] or
111    |             [
112    |                {
113    |                   "color": [r,g,b],
114    |                   "desired_velocity": [ex,ey]
115    |                },...
116    |             ],
117    |             "velocity_scale": float,
118    |             "next_destination": null or string,
119    |             "next_domain": null or string,
120    |             "next_transit_box": null or [[x0,y0],...,[x3,y3]]
121    |            },...
122    |        ]
123    |--------------------
124"""
125
126jdom = input["domain"]
127print("===> JSON data used to build the domain : ", jdom)
128
129"""
130    Build the Domain object
131"""
132
133jname = jdom["name"]
134print("===> Build domain ", jname)
135jbg = jdom["background"]
136jpx = jdom["px"]
137jwidth = jdom["width"]
138jheight = jdom["height"]
139jwall_colors = jdom["wall_colors"]
140if (jbg == ""):
141    dom = Domain(name=jname, pixel_size=jpx, width=jwidth, height=jheight,
142                 wall_colors=jwall_colors)
143else:
144    dom = Domain(name=jname, background=jbg, pixel_size=jpx,
145                 wall_colors=jwall_colors)
146# To add lines : Line2D(xdata, ydata, linewidth)
147for sl in jdom["shape_lines"]:
148    line = Line2D(sl["xx"], sl["yy"], linewidth=sl["linewidth"])
149    dom.add_shape(line, outline_color=sl["outline_color"],
150                  fill_color=sl["fill_color"])
151# To add circles : Circle( (center_x,center_y), radius )
152for sc in jdom["shape_circles"]:
153    circle = Circle((sc["center_x"], sc["center_y"]), sc["radius"])
154    dom.add_shape(circle, outline_color=sc["outline_color"],
155                  fill_color=sc["fill_color"])
156# To add ellipses : Ellipse( (center_x,center_y), width, height,
157#                            angle_in_degrees_anti-clockwise )
158for se in jdom["shape_ellipses"]:
159    ellipse = Ellipse((se["center_x"], se["center_y"]),
160                      se["width"], se["height"],
161                      se["angle_in_degrees_anti-clockwise"])
162    dom.add_shape(ellipse, outline_color=se["outline_color"],
163                  fill_color=se["fill_color"])
164# To add rectangles : Rectangle( (bottom_left_x,bottom_left_y), width,
165#                                 height, angle_in_degrees_anti-clockwise )
166for sr in jdom["shape_rectangles"]:
167    rectangle = Rectangle((sr["bottom_left_x"], sr["bottom_left_y"]),
168                          sr["width"], sr["height"],
169                          sr["angle_in_degrees_anti-clockwise"])
170    dom.add_shape(rectangle, outline_color=sr["outline_color"],
171                  fill_color=sr["fill_color"])
172# To add polygons : Polygon( [[x0,y0],[x1,y1],...] )
173for spo in jdom["shape_polygons"]:
174    polygon = Polygon(spo["xy"])
175    dom.add_shape(polygon, outline_color=spo["outline_color"],
176                  fill_color=spo["fill_color"])
177
178# To build the domain : background + shapes
179dom.build_domain()
180
181# To add all the available destinations
182for j, dd in enumerate(jdom["destinations"]):
183    desired_velocity_from_color = []
184    for gg in dd["desired_velocity_from_color"]:
185        desired_velocity_from_color.append(
186            np.concatenate((gg["color"], gg["desired_velocity"])))
187    dest = Destination(name=dd["name"], colors=dd["colors"],
188                       excluded_colors=dd["excluded_colors"],
189                       desired_velocity_from_color=desired_velocity_from_color,
190                       velocity_scale=dd["velocity_scale"],
191                       next_destination=dd["next_destination"],
192                       next_domain=dd["next_domain"],
193                       next_transit_box=dd["next_transit_box"])
194    print("===> Destination : ", dest)
195    dom.add_destination(dest)
196
197    # To plot all the desired velocity field
198    dom.plot_desired_velocity(dd["name"], id=10+j, step=20)
199
200print("===> Domain: ", dom)
201
202# To plot the domain
203dom.plot(id=0)
204
205# To plot the wall distance and its gradient
206dom.plot_wall_dist(id=1, step=20)
207
208plt.show()